|
Canadian Workers Labour 5 Years for Free July 12, 2009 By WC OŌĆÖCasey, http://fromthesmokepit.blogspot.com/ Striking CUPE public sector workers in Ontario are revealing the rapacious nature of capitalism better than any number of ŌĆśexposuresŌĆÖ, op-eds and news articles by the academic ŌĆśleftŌĆÖ press.┬Ā Not only are the courageous CUPE workers fighting for immediate gains against a backdrop of callous and brazen hostility, aimed a breaking the militant union, by the federal, provincial and municipal governments, a reactionary petty bourgeoisie and a venomous corporate media, they are also revealing the economic pillaging of workers wages, the squandering of Canadian productive capacity by corporate Canada and the true malicious nature of the Canadian ruling class towards workers. Corporate media hacks are hyperventilating trying to out do each other for the most intimidating and argumentative news item.┬Ā Attempts to ingratiate themselves with their corporate bosses are unwittingly bringing to light concealed and unnoticed information within the seedy backroom world of business council policy makers.┬Ā Material and data that may otherwise remain obscured from the scrutiny of workersŌĆÖ eyes is being publicized in a shrouded, but rather dramatic, fashion. The nature of Canadian imperialism is being revealed not so much in the very evident and real attacks on the CUPE workers, and organized labour in general, by the hired media hack mercenaries of the Miller Toronto municipal council, it is also shown in the anxiety in the economic theoreticians of the Canadian ruling class.┬Ā The Financial Post (FP) on June 23, 2009 published an article[1] that illustrated the alarm felt in the leading circles of corporate policy makers. In an unwitting attempt to make a case and ŌĆ£justifyŌĆØ the need to break organized labour and to provide evidence why the Canadian economy is in shambles, the Financial Post in their apparent hyper anxious state does the opposite.┬Ā The editors at the ŌĆ£PostŌĆØ in reality expose the real cause of the crisis ŌĆō capitalism and the irresolvable contradiction between social production and private accumulation.┬Ā If Harper wasnŌĆÖt so arrogant and vacuous he would have summoned the editors to the PMO and sternly reprimanded them for their careless ŌĆ£leakŌĆØ. Citing the growing strike activity by ŌĆ£public sectorŌĆØ workers, the Financial Post, tries to paint a picture that the ŌĆ£inflexibilityŌĆØ of unions fighting to hold onto ŌĆ£perksŌĆØ and ŌĆ£fringe benefitsŌĆØ has questioned the ŌĆ£roleŌĆØ and ŌĆ£futureŌĆØ of unions in Canada. Making a fallacious connection between Canadian labour productivity, workersŌĆÖ ŌĆ£protectedŌĆØ rights, and wages ŌĆ£linkedŌĆØ to productivity, the FP said, ŌĆ£At a time when workers rights are protected by law and wage increases are generally linked to productivity, competitiveness and the success of the company, the economic downturn has kicked up a storm of dust around the role of unions and their future.ŌĆØ Thinking workers would howl in jest at such a conclusion if it were not for the sinister undertones in the Financial PostŌĆÖs remarks.┬Ā Unions would smirk, roll eyes and shake their heads in collective unison if it were not for the real concessions forcefully extracted from collective bargaining agreements by a vindictive government-corporate coalition.┬Ā Taken in light of the very real attacks and worsening social and economic conditions of Canadian workers as they, yet again, endure another depression, the FPŌĆÖs malevolent and deceptive commentary can only be viewed as part of the general coordinated attack on Canadian workersŌĆÖ living standards by monopoly capital.┬Ā The Financial Post attempts to make a case for breaking the ŌĆ£unwilling unionsŌĆØ and defending ŌĆ£flexibleŌĆØ non-union companies.┬Ā Referring to economist Dale Orr of Global Insight[2], who bemoans that falling trade barriers, ŌĆ£openŌĆØ and global markets make it more difficult for non-union companies to compete for labour. ┬ĀAs the FP paraphrased, ŌĆ£But while a non-unionized company may have greater control over wages, Mr. Orr said this did not necessarily result in lower pay.ŌĆØ So what is buried in all of this that the striking CUPE workers are exposing?┬Ā The CUPE workers have agitated the Canadian ruling class to such an extent that the editors of the FP were compelled to counter with the same old tired union bashing trash. The June 23 Financial Post article leads astute readers to the heart of the matter by quoting a December 2008 Centre of the Study of Living Standards (CSLS) report[3].┬Ā Concluding from the CSLS report that, ŌĆ£unions once created value for workers in a protected economy[4] by extracting a share of a company's excess profits for workersŌĆØ the FP quoting Don Drummond, the senior vice president and chief economist at TD Securities as saying that this will mean that governments will begin to outsource more jobs in an effort to ŌĆ£cut expensesŌĆØ.┬Ā CUPE is on the frontline of that fight. Quoting the CSLS report, the Financial Post asserts, ŌĆ£Unions must therefore accept market conditions or face plant closure.┬Ā In the longer term, the unwillingness of unions to accept such conditions may potentially lead unionized firms to bankruptcy, while non-unionized competitors increase their market share.ŌĆØ So then this is nothing more than the same old union tired bashing tirade that the Financial Post, Toronto Star and Globe and Mail regularly engage in.┬Ā Well to a point.┬Ā If one is to read and study the CSLS report in more detail a completely different picture emerges.┬Ā It is a delineation that the Canadian ruling class is most alarmed by.┬Ā┬Ā But at the same time monopoly capital is fully engaged and most busily studying the effects and phenomenon described in the CSLS report.┬Ā That question that is in actual fact posed in the FP anti-union attack is; how can monopoly capital extract more unpaid labour time form Canadian workers to prop up falling rates of profit? The CSLS not only attempts to assist corporate Canada resolve that obstacle to their ŌĆ£profit dilemmaŌĆØ, they also reveal the extent to which the Canadian capitalist class has brutally exploited Canadian workers over the last 25 years and how they plan to continue to do so. Piecing together statistics from the CSLS report, Stats Canada and other sources a picture begins to emerge of the depths of wage larceny and the far reaching detrimental consequences on the Canadian economy of decades of shameless labour exploitation by the Canadian ruling class. The authors of the report in the Abstract openly state the real purpose of the study and reveal the magnitude and mechanisms on which Canadian and United States corporate profits are based.┬Ā Profits are based solely on the unpaid labour time of Canadian workers.┬Ā The report reveals the scandalous, immoral and criminal extent to which workers are exploited by the Canadian ruling class for its profits. The CSLS report Abstract says, ŌĆ£The most direct mechanism by which labour productivity affects living standards is through real wages, that is, wages adjusted to reflect the cost of living. Between 1980 and 2005, the median real earnings of Canadians workers stagnated, while labour productivity rose 37 per cent. This report analyzes the reasons for this situation.ŌĆØ┬Ā The authorsŌĆÖ suggestion that wages have ŌĆ£stagnatedŌĆØ is a gross understatement. Labour productivity[5] is a favourite topic of discussion amongst bourgeois academia.┬Ā Hundreds of studies, reports and statistics all attempt to prove that Canadian workers are not productive and that they ŌĆ£lagŌĆØ many other of the major industrial powers in this regard.┬Ā Such talk is erroneous. ┬ĀIf one is to believe this group of enlightened bourgeois labour economists all that is necessary to increase ŌĆ£lagging productivityŌĆØ is to do away with unions. What perplexes the Canadian ruling class and the CSLS authorsŌĆÖ the most is the central question posed and one that has baffled bourgeois economists for centuries; ŌĆ£why donŌĆÖt workers work harder?ŌĆØ┬Ā Taken from a Marxist or working class point of view the answer to the question is obvious ŌĆō workers understand that there is nothing in it for them to work harder, except an early grave. When viewed from a ruling class point of view the answer to the question becomes more frustrating and is met with a tirade of anti-worker theories that range from being ŌĆ£lazyŌĆØ to being ŌĆ£uneducatedŌĆØ and ŌĆ£unmotivatedŌĆØ.┬Ā All of these lead into the same old marsh of idealism and harsher ŌĆ£terms of tradeŌĆØ.┬Ā It is plain that the Center for the Study of Living Standards[6] falls into the later category.┬Ā Founded in 1995 by former Canadian Deputy Minister of Finance, Dr. Ian Stewart, the main objectives of the ŌĆ£independentŌĆØ CSLS are to:
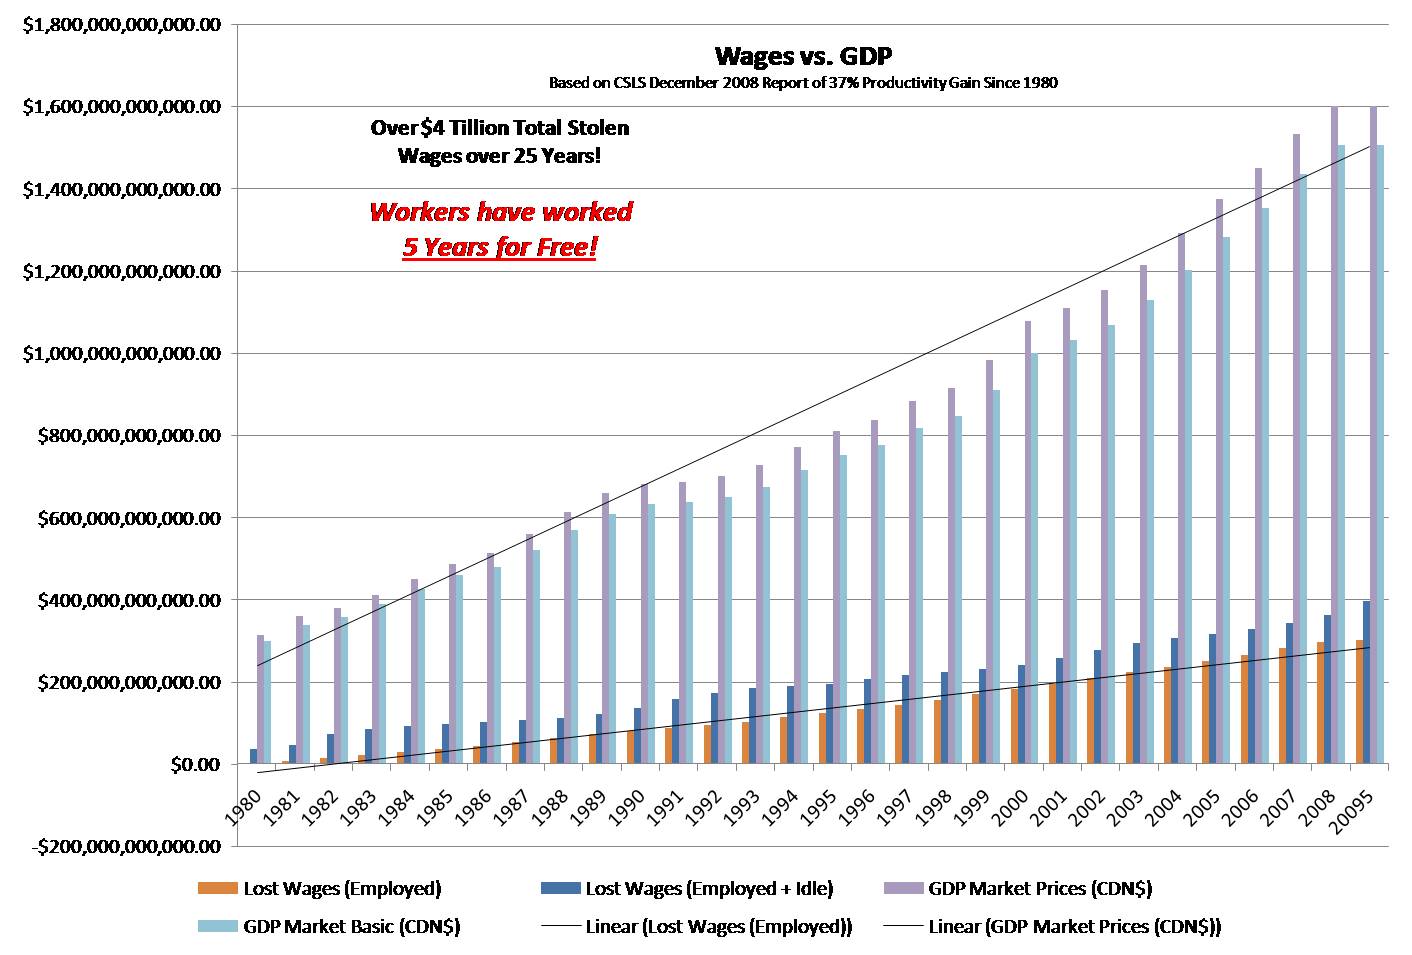
Such lofty goals and noble ideals can only be founded on the highest of principles and moral standing.┬Ā Therefore to achieve these honourable aims the CSLS is funded by a whoŌĆÖs who of corporate think-tanks, foundations and government agencies which include the Conference Board of Canada, the Organization of Economic Co-operation and Development, the Rockefeller Foundation and the Treasury Board to name just a few.┬Ā Don Drummond TD economist also holds a prominent spot on the board. The CSLS report intended for policy makers among the ruling elite also poses fundamental and basic questions for the working class. Firstly by defining what labour real wages are and what labour productivity is, in lexicon of bourgeois economic theory, the report poses the question; ŌĆ£Economic theory holds that at the aggregate level the growth of real wages are determined by labour productivity growth, a relationship mediated by the labourŌĆÖs share of output and labourŌĆÖs terms of trade (the price of output relative to the price of goods that workers consume). Neither increases in the labour share nor labourŌĆÖs terms of trade are likely to be a sustainable way of raising real wages because they fluctuate within fairly narrow bands. Only labour productivity growth can raise living standards in the long run. If short- and medium-term changes in the labour share or labourŌĆÖs terms of trade mean that Canadians are not benefitting from higher labour productivity in the form of higher real wages, then why should they support policies to increase labour productivity growth?ŌĆØ A good question indeed! Secondly, and most vexing to the economists, the report outlines the true disparity and depths to which workers are being fleeced by the ruling class.┬Ā Attempting to answer the question leads to only one solution for the bourgeoisie ŌĆō work workers harder, longer!┬Ā The report goes on to pose the following and most stunning exposition for all labour leaders, activists and progressive to study: ŌĆ£The release of data from the 2006 Census has sparked debate over the causes and consequences of the finding that median earnings of individuals working full time on a full-year basis barely increased between 1980 and 2005. Adjusting for inflation, annual earnings increased from $41,348 to $41,401 (in 2005 constant dollars), a mere $53 over 25 years. Over the same time period, labour productivity in Canada rose 37.4 per cent. If median real earnings had grown at the same rate as labour productivity, the median Canadian full-time full-year worker would have earned $56,826 in 2005, considerably more than the actual $41,401. These facts do raise an interesting and important question that this report seeks to answer: what accounts for the divergence between the growth of labour productivity and the growth of real wages?ŌĆØ Indeed!┬Ā What does account for $53 (0.13%) in real wage increases over 25 years while productivity increased by 37%?┬Ā Canadian workers have, on average, been swindled out of $8,946 per year!┬Ā Taken another way, over $268,000 in their lifetime!┬Ā So what is causing this?┬Ā It is a very intriguing question that the report fails to answer.┬Ā Even the authors admit in the reportŌĆÖs conclusions that, ŌĆ£In some sense, this report raises more questions than answers.ŌĆØ What!?┬Ā A study supported and funded by some of the biggest ŌĆ£expertsŌĆØ in the field of Canadian economics and they canŌĆÖt answer the question.┬Ā Or maybe they donŌĆÖt want to! [7] The final statement in the report says, ŌĆ£If most Canadians are not seeing the benefits of labour productivity growth in the form of higher real wages, why should they support policies favouring productivity growth?ŌĆØ┬Ā Again the bourgeois economists cannot (or refuse to) answer why Canadian workers have not ŌĆ£sharedŌĆØ in the ŌĆ£wealth creationŌĆØ and return full circle to the initial question posed in the reportŌĆÖs opening paragraph, answering absolutely nothing in the process except to resolve to return to the question at some later day and try again. It is much the same as the saying that questions the probability of a million moneys pecking away at a million typewriters infinitelyŌĆ”eventually one of them writes a novel.┬Ā Only we donŌĆÖt have to wait until our bourgeois economic cousins descend from the trees and begin the slow arduous journey to standing erect and making fire.┬Ā Marx has answered that question long ago.┬Ā The real irony in the report is how well they prove Marx.┬Ā It is remarkable what our economic simian cousins can unwittingly accomplish for the service of workers when given enough typewriters. The key findings of the report are fully stated in the first paragraph of the executive summary and which any worker with grade school math can figure out after a life time of calculating and studying the miserable pittance of paycheques that are doled out after a weekŌĆÖs work.┬Ā Workers can answer why!┬Ā Why canŌĆÖt the economists? Well now letŌĆÖs get to the meat of the matter.┬Ā The authorsŌĆÖ key findings are summarized as follows. From 1980 to 2005 annual earnings increased from $41,348 to $41,401, a mere $53 over 25 years. Over the same time period, labour productivity in Canada rose 37.4 per cent. That is all that is needed.┬Ā With access to some basics statistics from the internet of Canadian GDP and population over the same period a more complete picture can be sketched out to the extent that Canada is being pillaged, ransacked and shipped out. Our fiscal primates help out a little, however, when they do the productivity calculation for us and arrive at saying; ŌĆ£If median real earnings had grown at the same rate as labour productivity, the median Canadian full-time full-year worker would have earned $56,826 in 2005, considerably more than the actual $41,401.ŌĆØ Actually it is $15,425 more!┬Ā In other words 1.37 X $41,401 equals $56,826.┬Ā Projecting that number to 2009, using the same ratios, that number jumps again by another $2,468 per year.┬Ā Over the 25 year period that the study examined, real wages increased a total of $53.┬Ā That averages out to be less then the cost for a 2 litre carton of milk per year at $2.12.┬Ā If workers would have received the full benefit of the productivity gains over the same period it would have meant $619.12 per year, or a 29,000% increase!┬Ā And that is in year 1 of the 25 year period. Taking productivity into consideration, if we start in 1980 with productivity as 1, then productivity in 2005 would be 1.37.┬Ā Average annual productivity increases would be just under 1.5% at 0.0148 per year over the 25 year period.┬Ā Carrying that forward to 2009, productivity would equal 1.429. The population of Canada grew 9,177,722 to 33,694,000[8] over 25 years from 1980.┬Ā In 2009 the number of Canadians that worked for salaries and wages was over 18 million or just over 54% of the total population.[9]┬Ā In 1980 the total Canadian labour force was 11,879,400 for workers 15 years and older.┬Ā In 2009 the size of the labour force was over 18 million workers.[10]┬Ā The size of the working class grew by 55% in 25 years!┬Ā Over the same period of time the total Canadian population grew by 37%.┬Ā Utilizing the total number of workers from the working class that are employed and applying that number for each year, on average, 51% of the Canadian population works for wages or salaries. (Table 1) Applying the average lost wage of $619.12 per year per worker and adding it to each previous yearŌĆÖs last wage (and projecting it forward for 2006-2009 incl.) results in the total estimated wage that a worker should have received in 2005, which was calculated by the CSLS economists at just under $57,000. (Table 2) Taking the product of each yearŌĆÖs lost wages and multiplying by the total population we arrive at the total value of unpaid wages for each year of the 25 year period.┬Ā Summing the total unpaid wages by all wage earners in Canada from 1980 to 2009 we arrive at $3,973,026,443,300.00!┬Ā Or in other words over $4 trillion! (Table 3) Finally, taking the total Canadian GDP for each year we can calculate how much of each was spent by Canadian workers working for free.┬Ā If the lost wages that should have gone to the workers were never paid, but the values created, the actual material goods, and services are realized in GDP as they were appropriated by the bosses and sold as profit. Dividing the total lost wages for each year by the total GDP for that year we arrive at ratio of time working for wages that are not returned to the worker in wages. (Table 3) ┬ĀOn average it results in .14 of each year is spent labouring free for the bosses.┬Ā The total number of hours that a worker has worked for free over the 25 year period is 8,778 hours.┬Ā Over 25 years it amounts to 4.2 years.┬Ā But we donŌĆÖt really believe our economist experts are really telling the full truth[11] so letŌĆÖs just say - 5 years!!!
So the question that the CSLS economists pose; ŌĆ£what accounts for the divergence between real wages and productivity?ŌĆØ can now be answered ŌĆō capitalism.┬Ā It is due to the massive theft of workersŌĆÖ wages - 5 years of unpaid labour time.┬Ā Now that we know the answer our economist friends can get onto something more challenging - like how do Canadians get those unpaid wages back?
┬Ā
┬Ā ┬Ā [1] Alia McMullen, ŌĆ£Unions face uncertain future in global economyŌĆØ, Financial Post, June 23, 2009 [3] Sharpe, Arsenault, Peter, ŌĆ£The Relationship between Labour Productivity and Real Wage Growth in Canada and OECD CountriesŌĆØ, Centre for the Study of Living Standards, Research Report No. 2008-8, December, http://www.csls.ca/reports/csls2008-8.pdf [4] ŌĆ£Protected economyŌĆØ is another way of saying sovereign.┬Ā Therefore if unions ŌĆ£onceŌĆØ created value for workers in a sovereign economy and are ŌĆ£unableŌĆØ to do so now in a ŌĆ£competitive and deregulated worldŌĆØ the need for Canadian sovereignty becomes more urgent for Canadian workers.┬Ā Or looking at it from the other way, selling-out resources and Canadian sovereignty to US and foreign monopoly capital or the highest bidder means greater profits for US finance speculators and investors and lower wages for Canadian workers. [5] Labour productivity in the bourgeois economist lexicon really means higher rates of profits.┬Ā Profits can only be realized through the unpaid labour time of workers.┬Ā There is no other way to generate profits. [7] If it is the former then they are not real ŌĆ£expertsŌĆØ and all the funding by big business is just wasted time and ŌĆ£taxpayersŌĆÖ moneyŌĆØ.┬Ā If it is the later then they are barefaced liars and petty crooks (well maybe not as petty as we shall see).┬Ā Either way in the final analysis they only serve the interests of monopoly capital and not workers.┬Ā These are the lofty goals to which they aspire. [8] Statistics Canada, Table 051-0001 - Estimates of population, by age group and sex for July 1, Canada, provinces and territories, annual (persons unless otherwise noted) (table), CANSIM (database), http://cansim2.statcan.gc.ca/cgi-win/cnsmcgi.exe?Lang=E&CNSM-Fi=CII/CII_1-eng.htm, (Accessed July 11, 2009) [9] Statistics Canada, Labour Force Survey, Relseased July 10, 2009, CANSIM table 282-0087, Labour force characteristics by age and sex ŌĆō June, 2009, http://www.statcan.gc.ca/subjects-sujets/labour-travail/lfs-epa/lfs-epa-eng.pdf┬Ā┬Ā [10] Statistics Canada. Table 282-0002 - Labour force survey estimates (LFS), by sex and detailed age group, annual (persons unless otherwise noted) (table), CANSIM, http://cansim2.statcan.gc.ca/cgi-win/cnsmcgi.exe?Lang=E&CNSM-Fi=CII/CII_1-eng.htm (Accessed July 11, 2009) [11] Depending on which data set is used the numbers vary widely from 6 years down to 4.2 years.┬Ā Therefore we will let the bourgeois economist prove us wrong! [12] Statistics Canada, Table 051-0001 - Estimates of population, by age group and sex for July 1, Canada, provinces and territories, annual (persons unless otherwise noted) (table), CANSIM (database), http://cansim2.statcan.gc.ca/cgi-win/cnsmcgi.exe?Lang=E&CNSM-Fi=CII/CII_1-eng.htm, (accessed: July 11, 2009) [13] Statistics Canada, Table 282-0002 - Labour force survey estimates (LFS), by sex and detailed age group, annual (persons unless otherwise noted) (table), CANSIM (database), http://cansim2.statcan.gc.ca/cgi-win/cnsmcgi.exe?Lang=E&CNSM-Fi=CII/CII_1-eng.htm, (accessed: July 11, 2009) Note: Based on +15 Years Old [14] Sharpe, Arsenault, Peter, ŌĆ£The Relationship between Labour Productivity and Real Wage Growth in Canada and OECD CountriesŌĆØ, Centre for the Study of Living Standards, Research Report No. 2008-8, December, http://www.csls.ca/reports/csls2008-8.pdf, Executive Summary. [15] ibid [16] As ratio of the Estimated Wages Due to Productivity Growth ($56,826 in 2005) Minus Actual Wages Paid ($41,401 in 2005) Divided by 25 years (the period of the study) [17] This is 1980 is equal to 1, i.e. 100% was retuned to workers based on productivity in "Year 1" [18] This is the wages that the capitalists owe the working class for both Employed and Employed + Idle Labour based on the increases in productivity that were never returned to workers through wages. [19] Statistics Canada, Table 380-0030 - Gross domestic product (GDP) and Gross National Product (GNP) at market prices and net national income at basic prices, annual (dollars) (table), CANSIM (database), http://cansim2.statcan.gc.ca/cgi-win/cnsmcgi.exe?Lang=E&CNSM-Fi=CII/CII_1-eng.htm, (Accessed July 10, 2009) | |||||||||||||||||||||||||||||||||||||||||||||||||||||||||||||||||||||||||||||||||||||||||||||||||||||||||||||||||||||||||||||||||||||||||||||||||||||||||||||||||||||||||||||||||||||||||||||||||||||||||||||||||||||||||||||||||||||||||||||||||||||||||||||||||||||||||||||||||||||||||||||||||||||||||||||||||||||||||||||||||||||||||||||||||||||||||||||||||||||||||||||||||||||||||||||||||||||||||||||||||||||||||||||||||||||||||||||||||||||||||||||||||||||||||||||||||||||||||||||||||||||||||||||||||||||||||||||||||||||||||||||||||||||||||||||||||||||||||||||||||||||||||||||||||||||||||||||||||||||||||||||||||||||||||||||||||||||||||||||||||||||||||||||||||||||||||||||||||||||||||||||||||||||||||||||||||||||||||||||||||||||||||||||||||||||||||||||||||||||||||||||||||||||||||||||||||||||||||||||||||||||||||||||||||||||||||||||||||||||||||||||||||||||||||